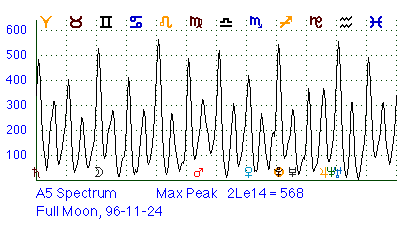
An A5 Spectrum graph is a snapshot of the planetary energies at a single moment in time. This snapshot is displayed in the form of a wavy curve on a graph that tells where in the zodiac the energies are most intense (peaks in the curve) and where the influences are less noticable (the valleys in the curve). A typical graph looks like:

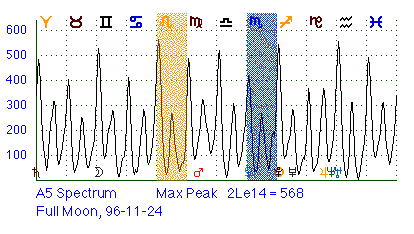
The horizontal scale of the graph gives positions around the zodiac. Each of the 12 vertical stripes is a zodiac sign of 30 degrees; the glyph for each sign (see the Zodiac Signs Help Page for the meanings of these glyphs) is at the top of the vertical stripe. For instance, in the following version of the same graph, the zodiac signs of Leo and Scorpio are colored gold and blue, respectively.
The glyphs of the planets are placed near the bottom of the graph in the correct zodiac position for each planet at that moment in time.
Note: this horizontal scale describes space (positions around the zodiac), not time!! The entire graph is for a single moment in time. This is the most common stumbling block to reading these waveforms.
The vertical scale measures the strength or intensity of the planetary influences at a particular zodiac position. This is measured in "units of aspect strength", aka "units". The higher the curve at some position, the stronger the energies are there. 100 units is the same as one planet's worth of energy. So if you see a peak that's 500 or so units, you can be certain a large number of planets are focusing their energies at this position.
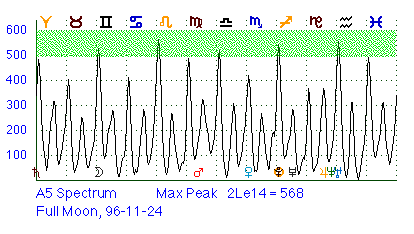
Certain regions of the strength scale are given their own colorful nicknames. For instance, the zone from 500 to 600 units (the green horizontal stripe near the top of the next graph) is called the Koz Alert region. Any time the A5 Spectrum has a peak that reaches into this zone, we have a Koz Alert. (These nicknames are explained on the Strength Help Page.)
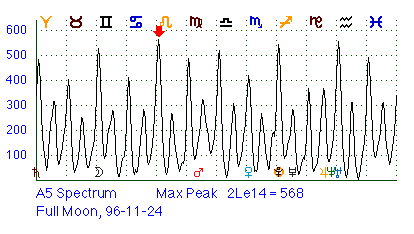
The first thing to do is find the tallest peak (or "main peak") in the waveform. Figure out how strong (in units) this peak is. In this example waveform, the tallest peak (marked with a red arrow) is in early Leo (2Le14, to be precise). The curve reaches up to 568 units here. That's the middle of the Koz Alert region, a pretty potent influence! The strength of the main peak gives an overall indication of how powerful and crazy the planetary energies are at this time. (This information is printed below the graph.)
Next, notice if the taller peaks occur at regularly spaced intervals. In the sample, there are 6 big peaks under the red arrows (including all 5 peaks above 500 units) spaced 2 zodiac signs apart. I call this a "6th harmonic" graph, which I abbreviate as "H6". If you include the next "level" of peaks (under the blue arrows), a pattern of 12 regularly spaced peaks emerges. This is a 12th harmonic or H12. There's also a prominent H24 (24 peaks) present. Harmonics are different colorations or moods of energy, some easy-going, others more difficult. Usually, there is a mixture of harmonics in a waveform. I list these in order of most to least important. A waveform without clear-cut harmonics is called a "noisy graph", the astrological equivalent of the static between radio stations.
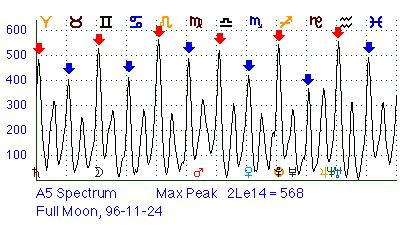
Notice whether the peaks are well focused (tall, thin and "crisp" looking) or scattered (shorter, fat, ragged looking, sometimes split into several "spikes" on top) in appearance. Focused patterns are more direct and forceful in the way these energies affect our lives, while scattered ones are ... well, scattered.
You can estimate the degrees within a zodiac sign where the taller peaks top out (about 2-3 degrees of each sign in this sample). Invariably, you will find the symbols of a number of planets sitting below these peaks. It's worthwhile to see which planets fall near these critical peak degrees, as these are the planets most responsible for generating the energy pattern you are seeing. As you get to know the individual planets better, you can see how the more potent planets in a pattern blend together to "color" a waveform.
As always, check whether these critical degrees (the peaks) fall in sensitive areas of your birthchart. When this happens, you act as a receiver or lightning rod that attracts this planetary energy into your life -- sometimes with spectacular results.